

Wastewater OptimizationEvery efficient plant starts with control & efficient pre-treatment.
Stabilize your biological process, cut costs, reduce downtime, and keep compliance effortless — with nanobubble aeration and monitoring engineered around your plant.
10–20%
Minutes, not days
Typical aeration energy savings
Upset detection time
Integrating proven technology from


01 - The ProblemWhat running your plant on guesswork is costing you.
Pain Points
Chemical dosing and aeration both run high, whether the process needs them or not.
You don't have live insight into what's actually happening inside your treatment process.
A sudden toxic spike in incoming wastewater is usually only caught after it disrupts treatment.
Business Impact
You're likely paying for more chemicals and energy than the process actually requires.
Unexpected upsets mean emergency repairs and lose operating time.
Discharge violations bring fines and regulatory scrutiny.
What would change if aeration only ever cost you what your biology actually needed — with nothing added to the water?
The audit is the starting point — not a formality.
02 — What we actually doMost firms treat the mandatory audit as paperwork. We treat it as the diagnosis that tells us whether you need new technology at all, or just better-run equipment.
01
Loading patterns, blower runtime, diffuser condition, sludge behaviour. Real conditions, not design documents.
We assess on site
02
We show you the numbers
Where the energy actually goes, what it's costing you per year, and how that maps against the directive's targets. In plain terms, with the maths shown.
03
We recommend honestly
Sometimes the answer is nanobubble pre-treatment. Sometimes it's replacing worn diffusers. If your setup is already efficient, we'll tell you that — and you'll have your audit on record either way.
03 — When the answer is new technologyWhat is a nanobubble, and why does it cut the bill?
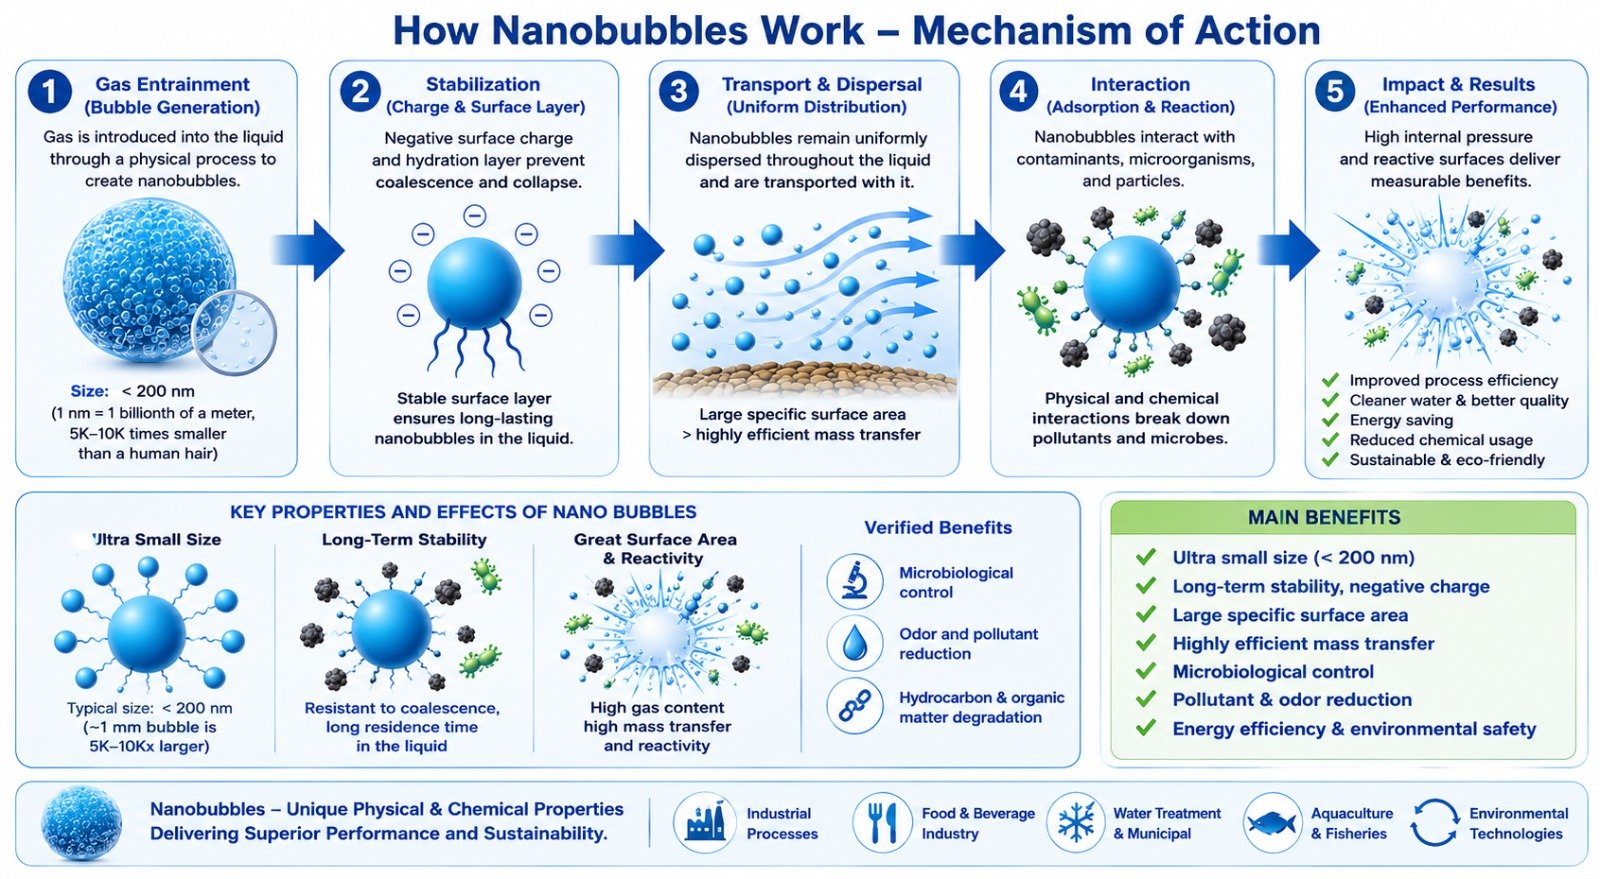
Think of a jacuzzi. Traditional aeration pumps massive bubbles that rush to the surface and burst in seconds — wasting a large share of your plant's energy in the process.
Nanobubbles are over 2,500 times smaller than a grain of salt. Too small for buoyancy to lift them, they stay suspended in the water for weeks, releasing oxygen where the bacteria need it. Same treatment, far less compressor runtime, less chemicals — and it fits the basins you already have.
04 - How the system actually worksThree parts. One integrated system.
Nanobubble hardware and biological sensors are both, on their own, just equipment. The reason to call RASTA-TECH isn't either one alone — it's how we combine and tune them for your specific plant.
The Hardware— Powered by ChucaoTech
Inline & in-tank nanobubble pre-treatment
High‑efficiency generators dissolve oxygen into the water column far more effectively than conventional blowers reducing energy use and minimizing chemical demand.
Sensing & data — Powered by SENTRY
Real-time biological monitoring
Bio‑electrode sensors provide minute‑by‑minute visibility into microbial activity, allowing aeration to follow real biological demand rather than fixed timers
RASTA-TECH
Engineering, applied to your plant
We size the hardware, select the right sensing setup, integrate everything into your existing basins, and keep tuning the system as your plant’s real behavior becomes clear — the part no equipment vendor actually does for you.
What we install to solve it.
We specify, source and commission the right equipment for each stage of your process — matched to your plant, not sold from a catalogue. A selection of what we work with:
Pre-Treatment
Removing solids, grit and grease before the biological stage
Screens & combined pre-treatment plants
Grit removal & classifiers
Grease separators
Conveyors & compactors
Equipment via Estruagua
Treatment & filtration
Chemical-free oxygen transfer and downstream polishing
Nanobubble aeration systems
Tertiary filtering disks
Filtering & overflow screens
Penstocks & weirs
Nanobubble via ChucaoTech · filtration via Estruagua
Measurement & control
Live insight so the process runs on data, not guesswork
Bio-electrode process sensors
Real-time monitoring dashboard
Sensing via SENTRY
05 - Straight answersQuestions operators actually ask.
-
Answer: Start with aeration — typically the single largest electricity consumer (≈50–90%). An on‑site energy audit identifies which measures give the best ROI before capital is committed.
Business highlights
Primary levers: match oxygen to biological demand; replace worn/coarse diffusers with fine‑bubble or nanobubble systems; implement data‑driven blower control.
Financial view: diffuser replacement and control tuning are often lowest‑cost, fastest‑payback actions.
Risk/benefit: operational changes carry low risk; equipment upgrades need pilot data to de‑risk investment.
Next step: commission an energy audit to quantify savings, costs and payback.
-
Answer: Nanobubbles are extremely small gas bubbles that remain suspended, increasing contact time and improving oxygen transfer without chemicals. Site conditions determine actual benefit — measure with a pilot.
Business highlights
Technical benefit: longer suspension → higher oxygen transfer efficiency.
When it makes sense: plants with poor diffuser performance or high aeration energy use.
Commercial caution: vendors promising a single % saving are unreliable — require site trials.
Next step: run a short pilot and measure DO, kLa, and energy per kg O₂ transferred.
-
Answer: The revised Urban Wastewater Treatment Directive (2024/3019) mandates energy audits, raises energy‑neutrality expectations, and lowers the scope to 1,000 PE. Start with a documented audit and benchmark.
Business highlights
Compliance: audit + documented plan will be required; keep records for inspections.
Strategic value: audits identify prioritized measures that reduce operating costs and regulatory risk.
Operational impact: expect phased targets; plan investments and O&M changes accordingly.
Next step: schedule an audit that includes benchmarking and a prioritized investment plan.
-
Answer: Usually no — most nanobubble systems retrofit into existing basins and piping. A site assessment confirms feasibility.
Business highlights
Typical scope: equipment retrofit with minimal civil works.
When civil work is needed: unusual hydraulics, access constraints, or structural issues.
CapEx implication: retrofit costs are typically lower than full basin rebuilds.
Next step: site visit to confirm installation scope and cost estimate.
-
Answer: Savings vary by site; there’s no universal percentage. Use an assessment or pilot to measure real savings before scaling.
Business highlights
Why it varies: water quality, temperature, loading, and current operation all affect results.
Procurement tip: require measured pilot data and guaranteed performance clauses where possible.
Decision metric: base investment on measured kWh/kg O₂ reduction and payback period.
Next step: propose a scoped pilot with clear measurement protocol and success criteria.
-
Answer: No. A credible audit can recommend low‑cost operational fixes (e.g., diffuser replacement, control changes) or no capital spend at all. The audit itself is a documented asset.
Business highlights
Independent value: audit provides an evidence base for investment decisions and regulatory records.
Possible outcomes: operational tweaks, targeted replacements, or pilots — not always new equipment.
Procurement safeguard: include an objective scope and deliverables; keep the report regardless of vendor proposals.
Next step: request a proposal that lists deliverables, measurement methods, and decision gates.
-
Answer: Increasingly yes — the directive lowers the threshold from 2,000 PE to 1,000 PE, bringing many smaller plants into scope.
Business highlights
Action trigger: check your population equivalent (PE) now.
Opportunity: smaller plants often have simpler systems and faster paybacks on basic fixes.
Support: consider phased audits or pooled procurement for cost efficiency.
Next step: confirm PE and schedule a scaled audit if near or above 1,000 PE.
-
Answer: Cost depends on plant size and complexity. You’ll receive a documented energy breakdown, prioritized measures, and estimated costs and paybacks.
Business highlights
Deliverables: energy consumption breakdown; benchmark vs peers; prioritized measures; cost and payback estimates; compliance notes.
Pricing model: scaled to complexity — provide plant size and layout for a tailored quote.
How to use it: supports CAPEX decisions, OPEX reductions, and regulatory compliance.
Next step: share plant size, PE, and basic layout to get a clear proposal.
ContactLet’s explore the right solution for your system
Whether you need support with nanobubble technology, biogas monitoring or water treatment optimization, our engineers are here to help.
Have any questions? Fill out the form or reach out via email. Response time: within 24 hours.
